
Maps, Visualizations & Diagrams
Bringing data to life
In a world full of data, it is crucial to prepare information so that it is easy to understand and accessible. Interactive maps, visualizations, and diagrams enable complex data to be presented in a way that is intuitive and engaging. They help identify patterns, track trends, and make decisions based on clear insights.
Interactive visualizations offer your company the opportunity to present information appealingly and better inform your customers and employees. When data is optimally implemented and visualized, you can grasp complex relationships at a glance and communicate effectively.
Enhanced Decision-Making
Visualized data helps capture important information more quickly and make informed decisions.
Whether in news, on websites, or in business reports – visual representations are encountered daily. Maps, for instance, show us where branches are located or how sales figures are distributed across regions. Charts and graphs illustrate financial developments, survey results, or other key metrics.
Use Cases
- Location Visualization.
Show your customers where your offices, branches, or partner companies are located. This facilitates contact and strengthens your presence. - Real-Time Data Visualization.
Display current data in real-time, such as sales figures, visitor statistics, or production numbers. - Geographic Data Analysis.
A chart can show how sales figures have developed over time, while the map depicts their geographic distribution. - Interactive Dashboards.
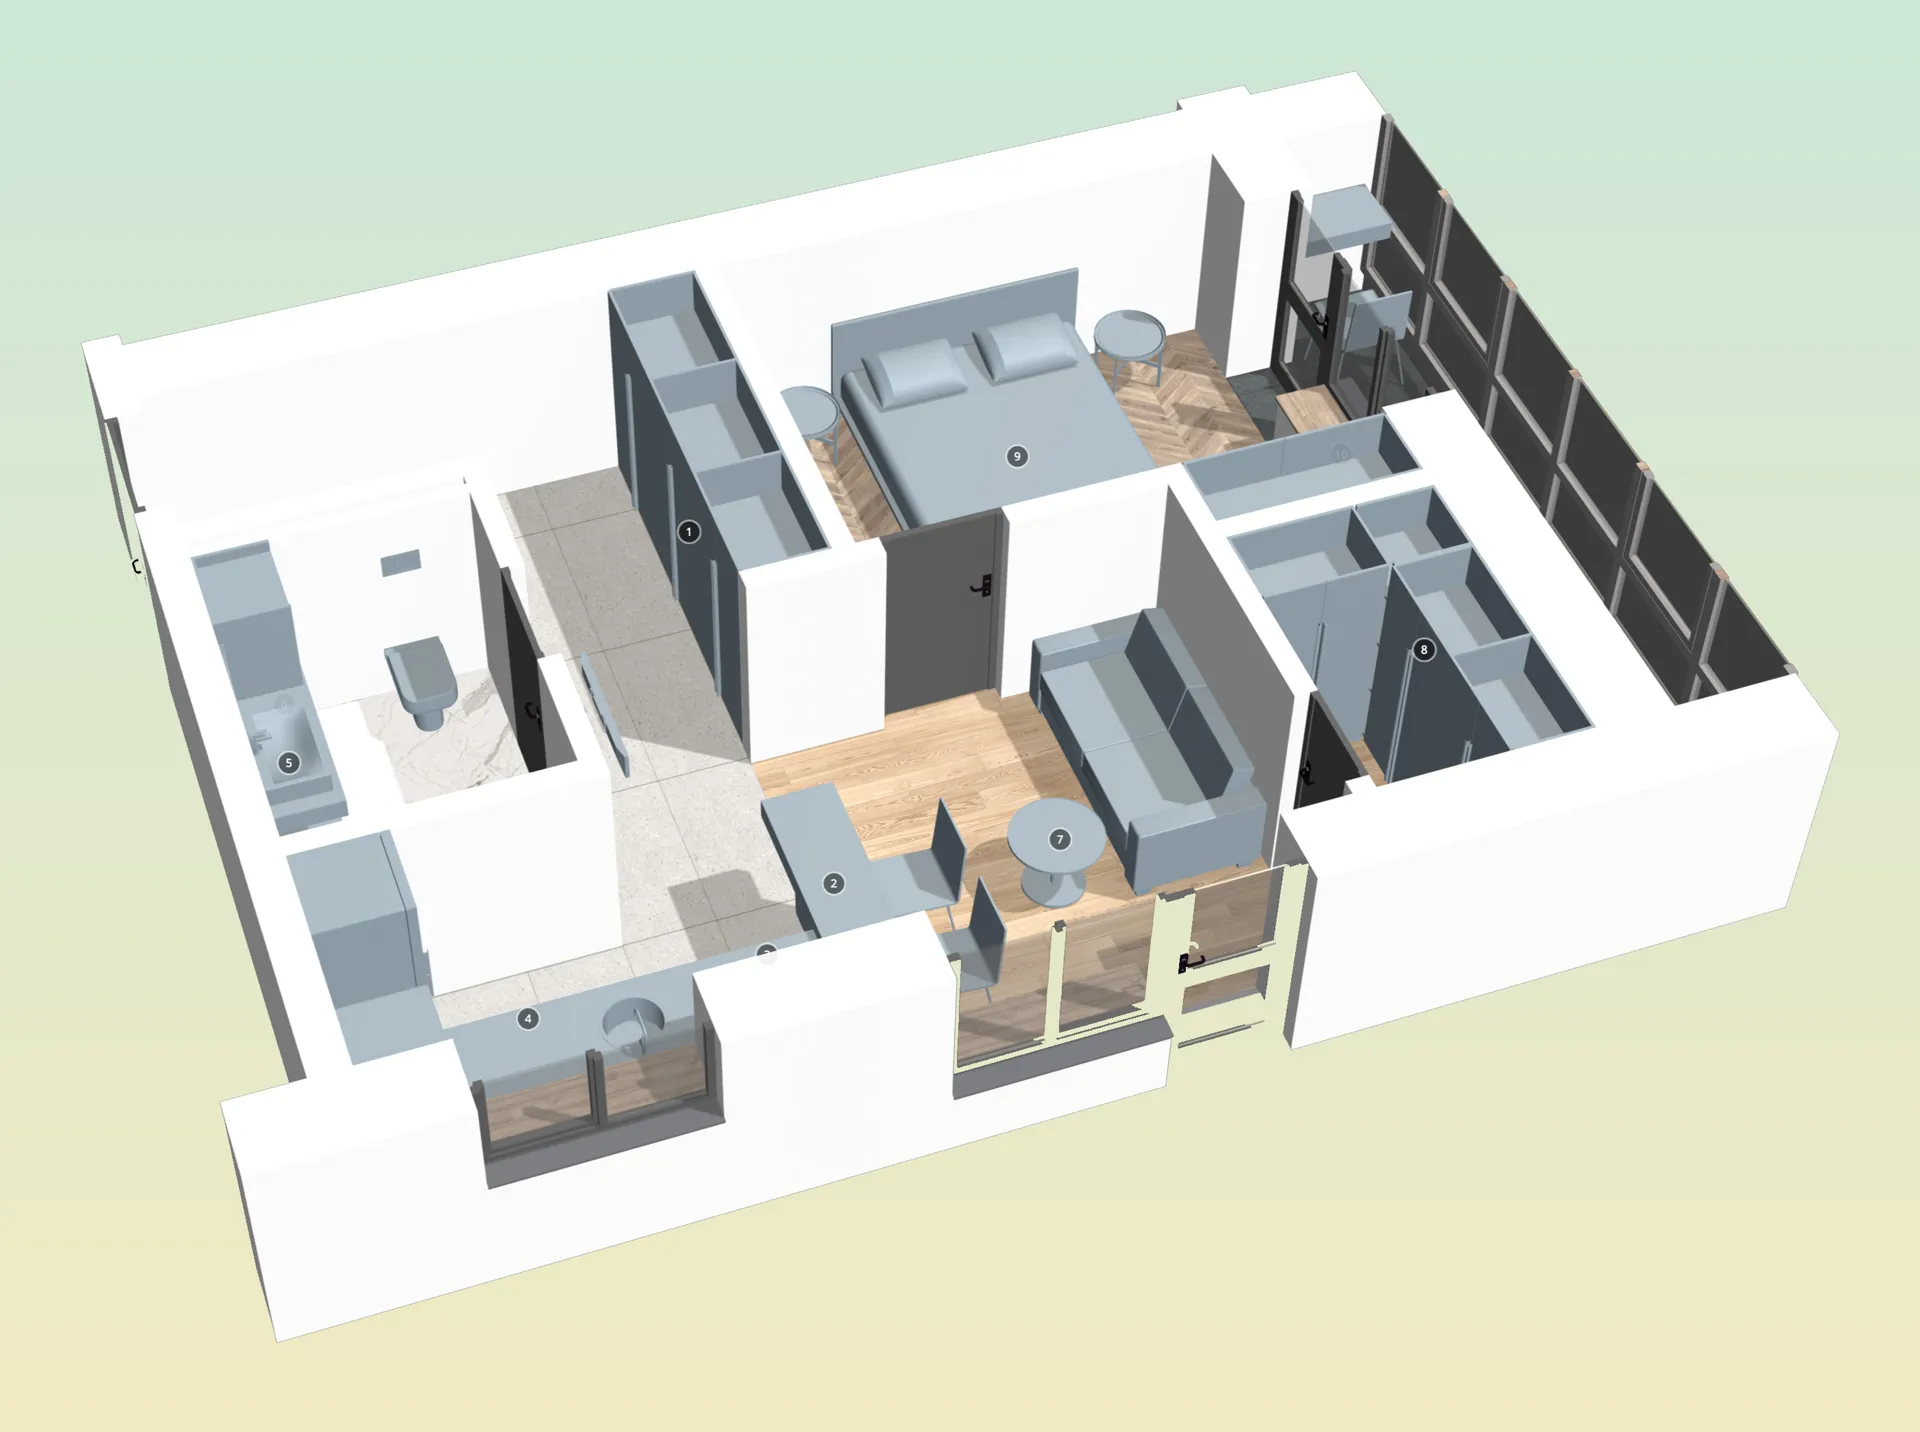
We create dashboards that combine maps, charts, and other visualizations. - 3D Building Plans.
Present your construction projects in 3D, allowing customers to get a realistic impression.
Visualized data helps capture important information more quickly and make informed decisions. Appealing and interactive presentations increase interest and improve the user experience on your website or in your applications.
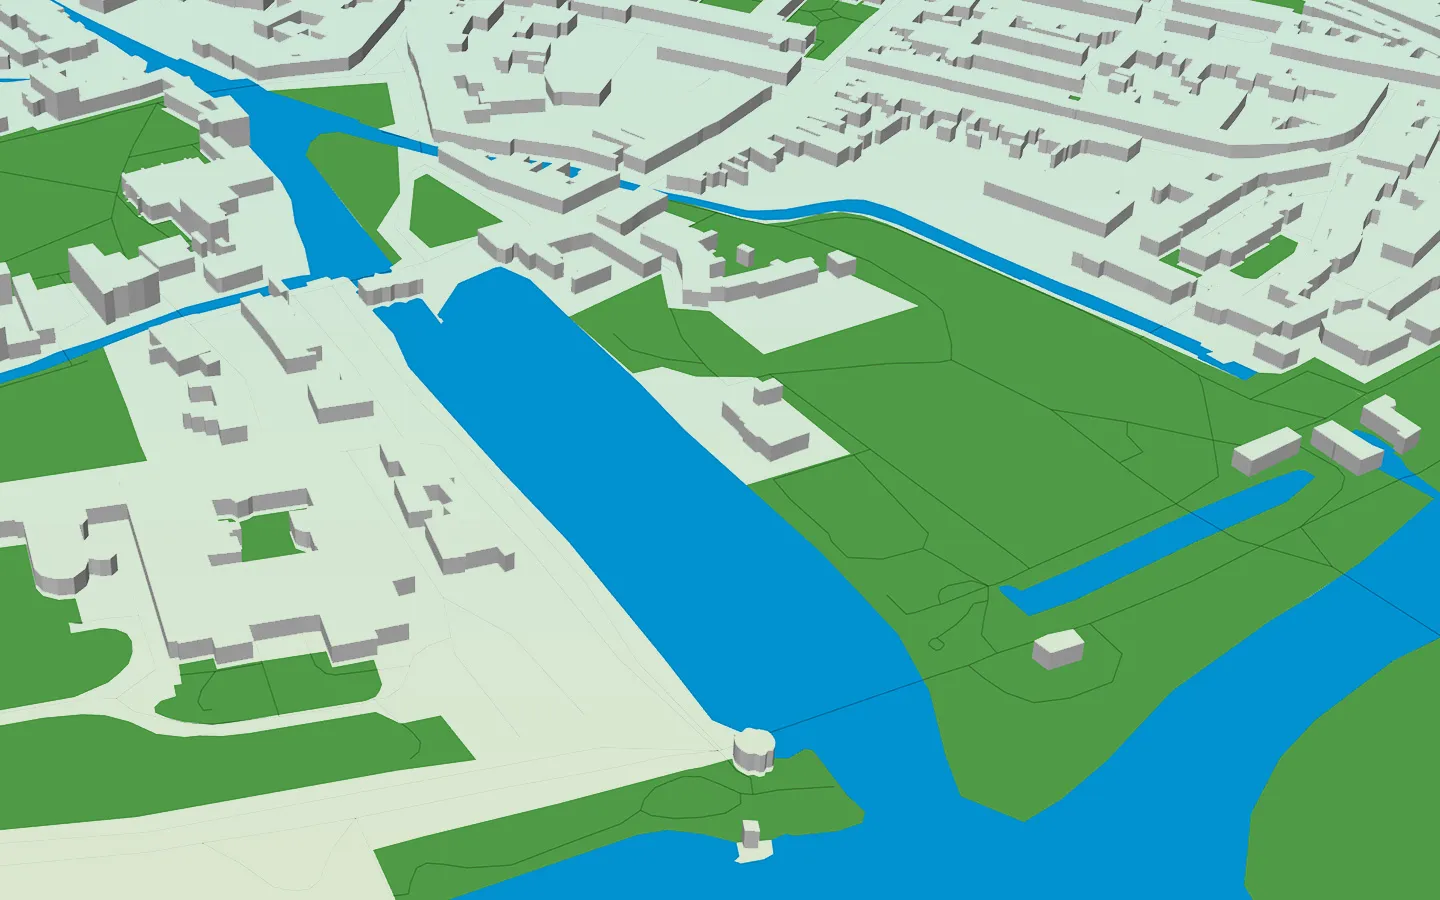
Maps
Static Data on Maps
We create maps tailored precisely to your needs. Whether you want to display the locations of your stores, mark delivery areas, or facilitate navigation for customers – we design the maps according to your specifications. By integrating map providers, we can work flexibly and provide you with up-to-date map data.
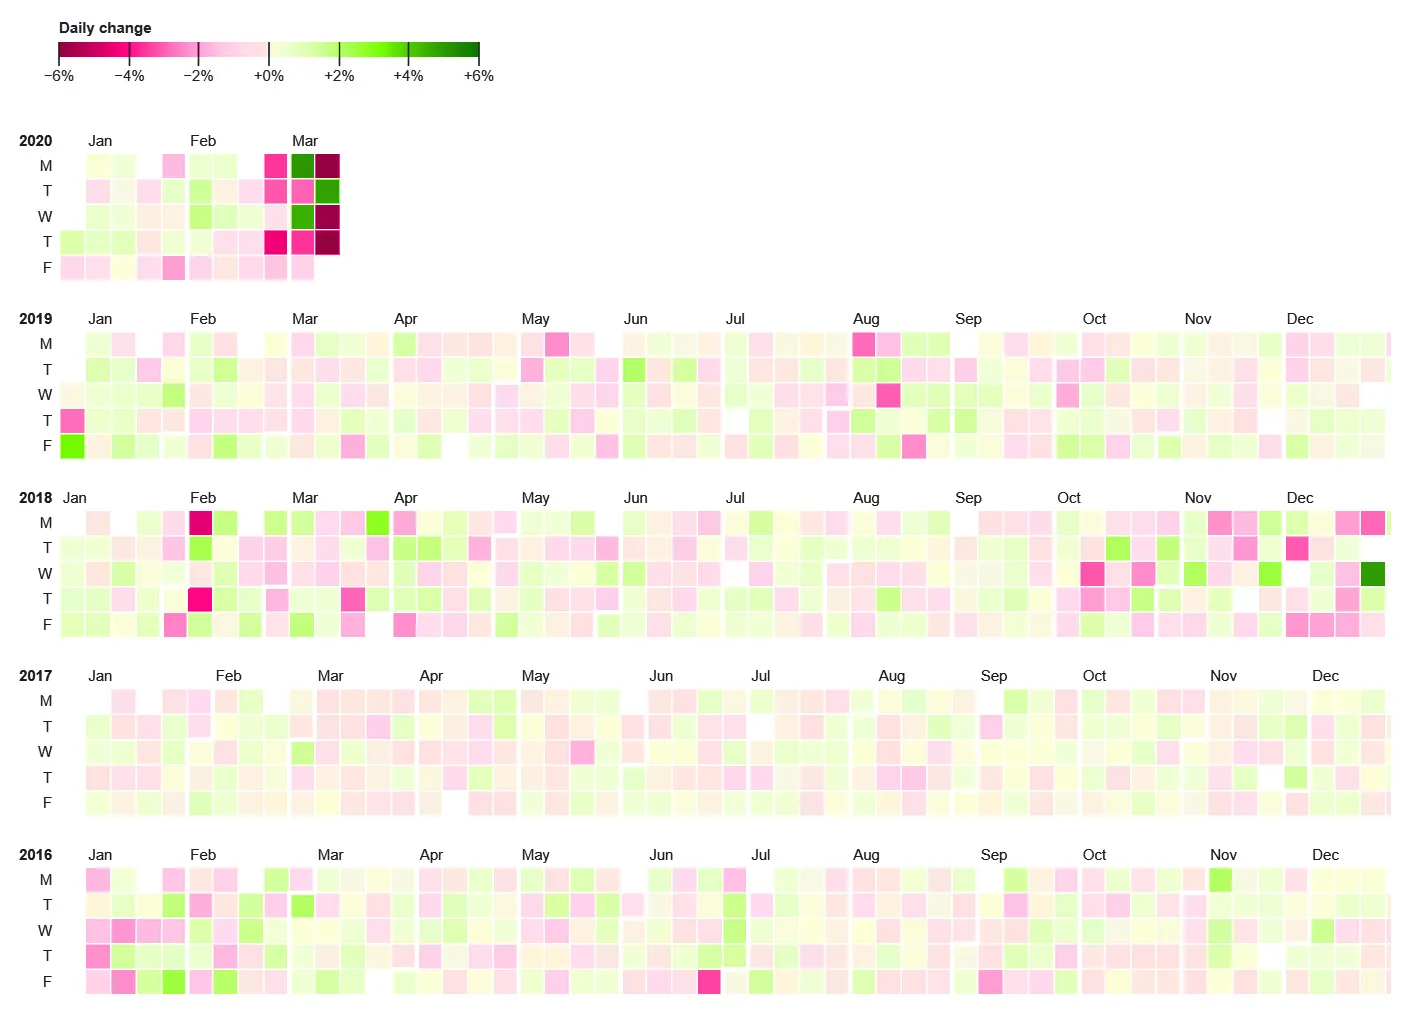
Charts
Interactive Statistical Data
Bar, line, or pie charts present data in an illustrative way. Users can interact by selecting time periods, highlighting specific data points, or displaying details. This fosters understanding and engagement with the information.
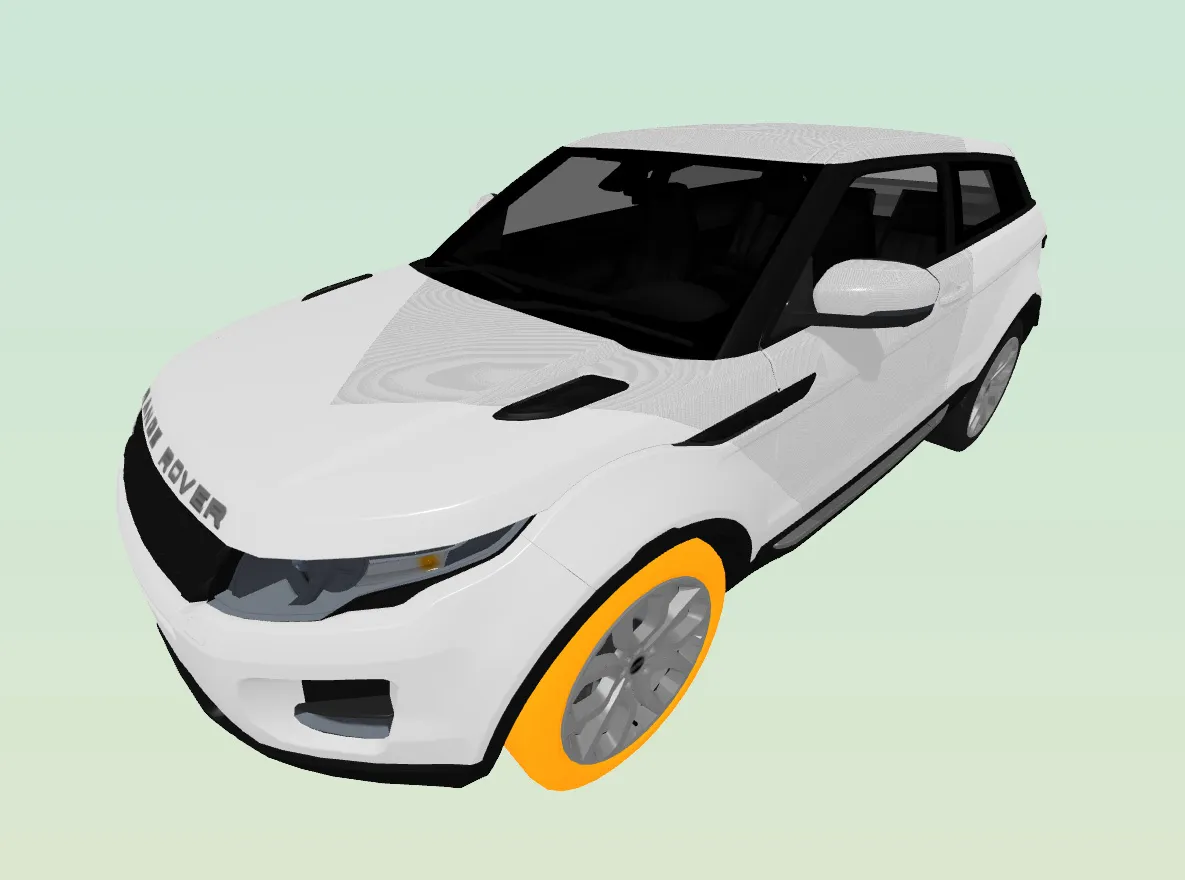
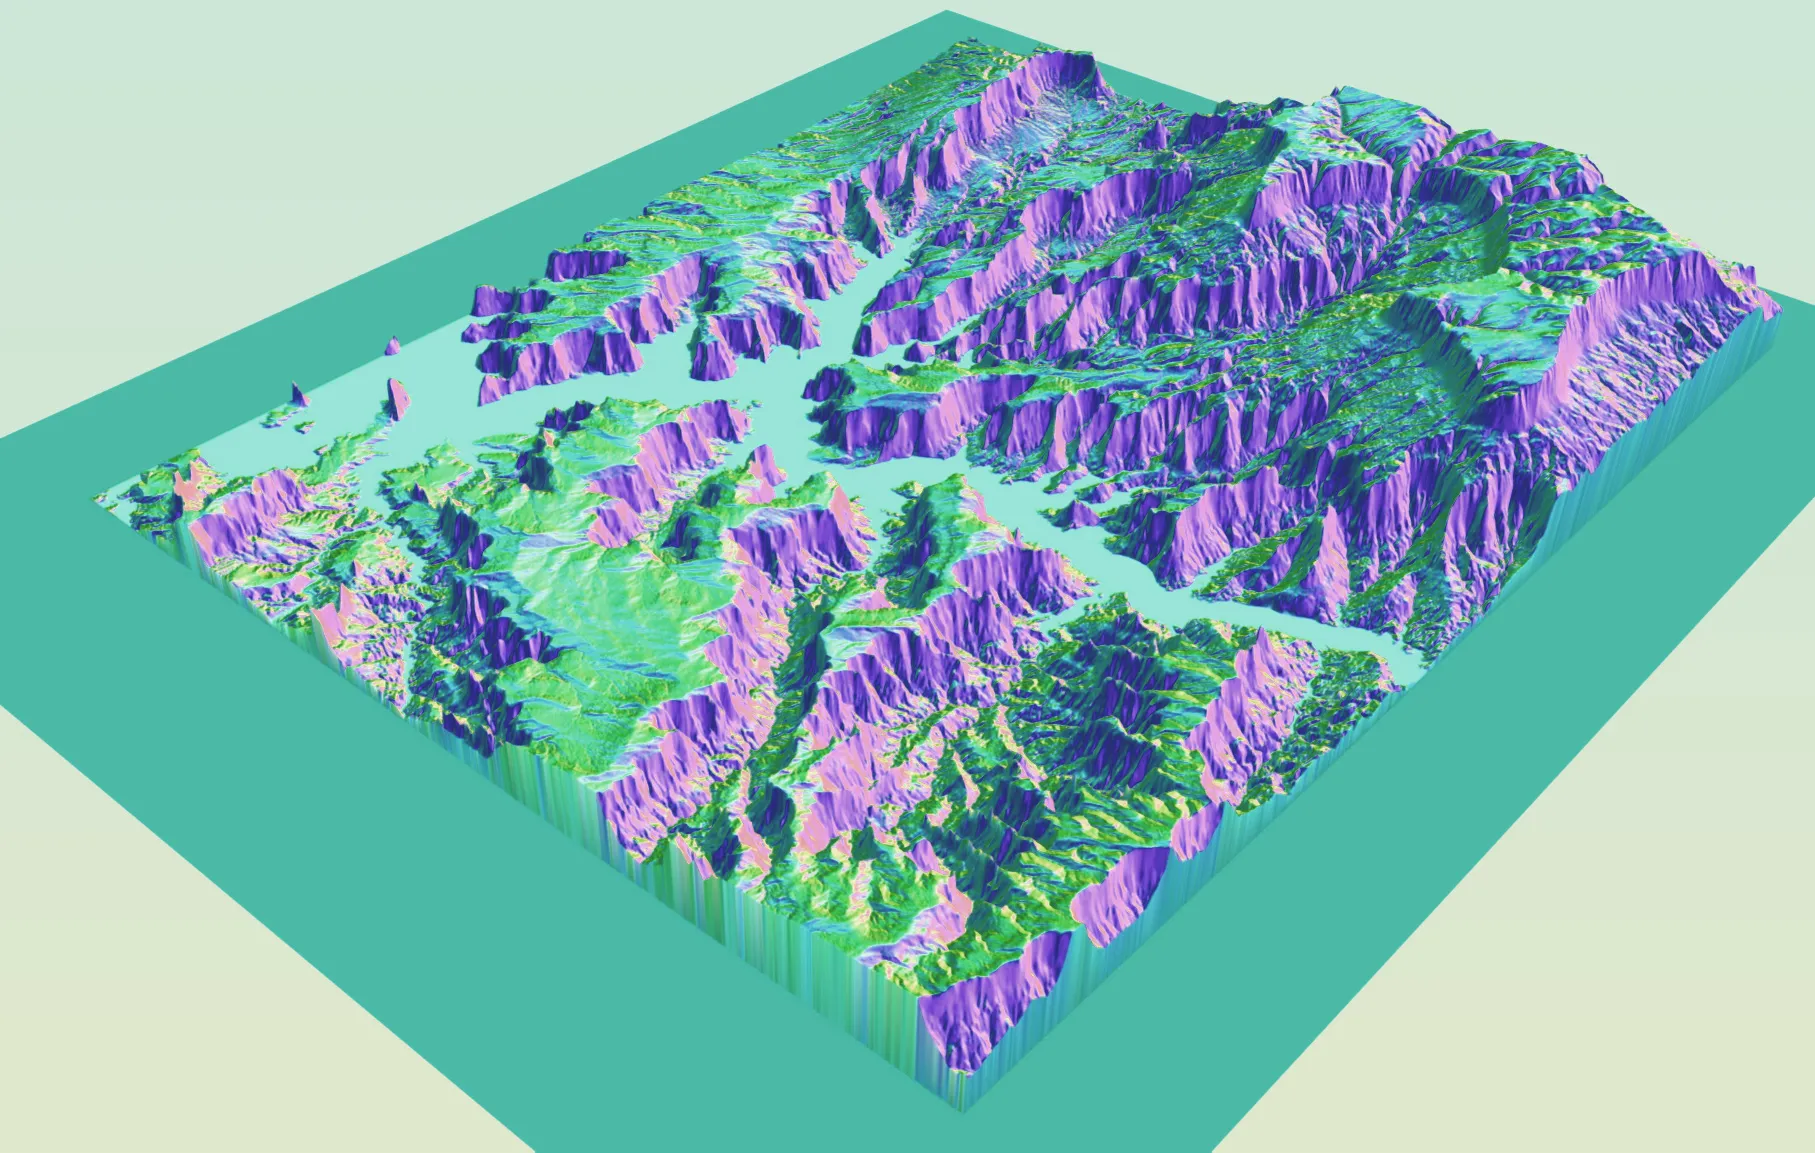
Visualizations
Virtual 3D Tours
Modern technologies allow visualizations to be displayed in three dimensions, which can be particularly impressive and informative. Virtual tours through buildings or facilities increase interest and improve understanding of your project.